Every significant B2B purchase is shaped by more people than the salesperson ever meets. Some sign the contract, some recommend, some can quietly veto, and many simply have to live with the result. The Power Matrix puts that network on a single page.
It forces a salesperson to answer three questions about every major opportunity: Who can influence this decision? How much power does each of them really have? How well do we know them? A salesperson who can complete the Power Matrix for every account will be phenomenally successful. One who can’t will find that the empty cells show exactly where the deal is exposed.
This overview explains how the matrix is structured, how to build one, and how a sales leader can use it to judge the real health of the team’s largest opportunities.
An influence chart, not an organizational chart
The Power Matrix maps who influences one specific purchasing decision. It does not map who reports to whom. That single distinction drives everything else about the tool.
Two people on the same row may hold different titles, report to different executives, and work in different parts of the company. They’re on the same row because they carry roughly the same weight in this decision. Likewise, someone placed above another in a column does not need to be that person’s boss. They need to respect each other’s opinions.
Titles are a poor guide to power. A title often reflects tenure rather than influence, and a sharp Director can carry as much weight as a Vice President, especially across departments of very different sizes. Build the matrix by watching how people react to one another, whose opinion others seek, and whose objections stop a conversation.
Two versions, sized to the opportunity
The matrix comes in two sizes. The larger one requires far more research and relationship-building, so the deal must justify the effort.
Characteristic
Small Power Matrix
Large Power Matrix
Grid
3 × 3
5 × 5
People identified
9
25
Departments
3
5
Influence levels
3
5
Typical deal size
Below roughly 5–10% of annual quota
Above roughly 10% of annual quota
Center cell
Primary Coach
Primary Coach
The quota cutoff is a guideline, not a rule. Adjust it for your product and industry. As a sanity check, a salesperson with a reasonable win rate should rarely need more than about 10 Large Power Matrix analyses in a year. If someone is building 20 or more, the threshold is set too low, and they are spending large-deal effort on small deals.
How the grid is organized
The Power Matrix has two axes, and both are about the decision, not the org chart.
Columns are departments, arranged by how much they gain. The department that benefits most from the decision sits in the center column. Departments with less to gain move toward the edges.
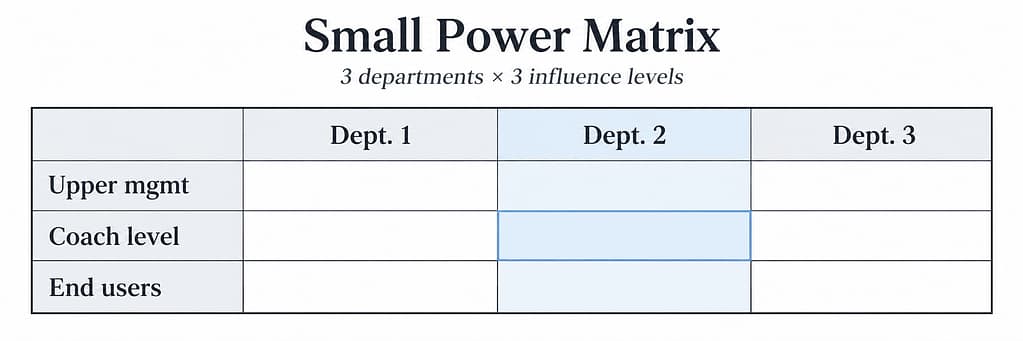
Rows are relative power over the decision. Upper management sits at the top, Coaches in the middle, and end users at the bottom. Everyone on a row has roughly equal influence on this decision.
The center cell holds your primary Coach. A Coach is an insider who helps you understand the account and navigate the decision. The best Coach has a direct personal stake in the outcome, so the primary Coach sits in the department with the most to gain. If your Coach sits in a department with little at stake, find another who does.
The cell directly above the primary Coach is your best potential Champion. This leader runs the department with the most to gain and respects your Coach’s judgment, which makes them the most natural executive sponsor for your proposal.
Everyone on the Coach row should become a Coach. One purpose of the matrix is to push the salesperson beyond a single friendly insider. A 3×3 matrix asks for three Coaches, one in each department. You can never have too many Coaches, and relying on one creates a single point of failure.
The two layouts
Small Power Matrix (3 × 3)
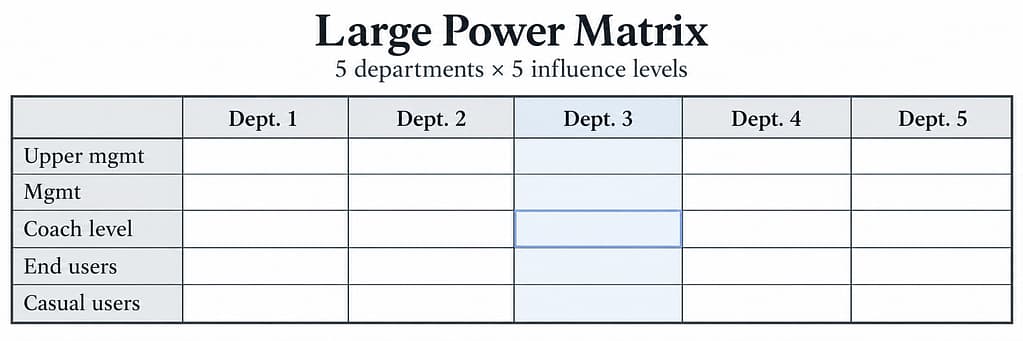
Large Power Matrix (5 × 5)
The large version follows the same logic with more resolution. Departments in columns 2 and 4 gain meaningfully; those in columns 1 and 5 gain less. Large organizations often have several VPs and Directors in one department, so place whoever carries the most weight in this decision highest, regardless of rank. Other departments may commit fewer people, so the rows won’t always line up with titles across columns.
Below the Coaches, end users are split by involvement. A user who takes part in every stage of the evaluation sits on the Active row, just below the Coach. A user consulted only occasionally sits on the Casual row at the bottom.
How to build one
Define the decision. A Power Matrix belongs to one opportunity, not to an account in general. The same company can produce very different matrices for two different purchases.
Choose the size. Use the deal’s value against annual quota to pick the Small or Large version.
List the affected departments and rank them by benefit. Put the department with the most to gain in the center and those with the least on the outside.
Place your primary Coach in the center cell. Then test the placement: does this person personally gain from the decision, and do they sit in the department with the most at stake? If not, start developing another Coach who does.
Identify the Champion. Name the leader directly above your Coach, the person who runs the department with the most to gain.
Fill the rest of the Coach row. Find people in the other departments who will help you understand how the decision looks from their side.
Place leaders and users by actual influence. Watch whom others defer to, consult, and follow. Ignore titles when they conflict with what you observe.
Record how well you know each person. A name in a cell is not a relationship. Note whether you have met them, understand their priorities, and know where they stand on your proposal.
Turn the gaps into a plan. Turn every empty cell or thin relationship into a specific action: who will make the introduction, what meeting is needed, and by when.
If you can’t find nine people for a Small Power Matrix, keep digging. Very few organizational decisions affect fewer than nine people, and anyone affected can influence the outcome.
Using it throughout the sales campaign
The Power Matrix is a working tool, not a one-time exercise. Revisit it every time something meaningful changes in the deal.
Keep it current. People change roles, priorities shift, alliances form, and decision responsibility moves. A matrix built in month one can be wrong by month three.
Watch for single points of failure. If every relationship runs through one Coach, the deal is fragile. Losing that person means losing your view of the decision.
Track attitude inside the cells. Score each person from -5 to +5 on how strongly they support or oppose you, in general or in this opportunity. A +5 is an exceptionally strong supporter, 0 means they don’t care, and -5 is a strong dissenter who probably favors a competitor. The score is a subjective judgment, so revisit it as the deal moves. Support and opposition inform the analysis, but they do not change where a person sits.
What the Power Matrix is not
It is easy to confuse the Power Matrix with a conventional power-versus-interest grid that plots stakeholders by influence and attitude. That is a different tool. The Power Matrix’s two axes are always departments, arranged by benefit, and relative power over the decision. Labels such as decision-maker, gatekeeper, champion, or blocker are useful notes about the people in the cells. They are not the matrix’s structure.
What leaders should look for
For a company leader, the Power Matrix is one of the fastest ways to test whether a forecast deal is real. Ask to see it in every review of a significant opportunity, and look for these signals:
Empty cells. Each one is a person who can influence the decision and whom the team doesn’t know. A large opportunity with half the grid blank is a hope, not a forecast.
One Coach. If the Coach row has a single name, the team has no backup if that person leaves, loses influence, or changes sides.
A misplaced primary Coach. If the center cell isn’t in the department with the most to gain, the team may be selling to the wrong part of the organization.
No Champion relationship. Ask who sits directly above the primary Coach and when the team last spoke with that person.
A copied org chart. If the grid mirrors the official hierarchy title for title, the salesperson likely pulled it from the company website rather than observed it.
A stale matrix. Ask when it was last updated and what changed.
Used consistently, the Power Matrix gives the whole team a common language for discussing accounts. It also turns vague confidence into a concrete list of relationships to build, which is exactly what a leader needs to coach toward a win.
If you learned a bit more about how to manage your sales organization from this article, you may also benefit from another overview that I wrote several years ago on the Power Matrix. You can find it here: Welcome To The Power Matrix